

 LinkedIn
A visibility dashboard can fall from 68% to 44% while your site stands still. Two days later, it can climb back to 62% without a new page, a technical fix, or a competitor retreat.
AI visibility is not a rank you hold. It is a probability you estimate by sampling a system that can give different answers to the same prompt. Until you understand which prompts were sampled, how much the answers varied, and the difference between what an engine said and what its bots fetched, a weekly score is noise wearing a decimal point.
Consider a company selling warehouse inventory software. A buyer asks an AI engine to recommend tools. The company might appear in one answer, disappear from the next, and return in a third. That does not necessarily mean its standing changed twice. First, we need to understand what produced those answers.
Why the same prompt can produce different brand lists
In classic search, a query generally returns a reasonably predictable set of results. Search for “warehouse inventory software” twice from the same desktop browser within ten minutes, and the results will usually look much alike. An AI answer is assembled differently: a language model generates text by selecting tokens from a probability distribution. It may also use retrieved web material to inform that generation.
The distribution matters more than the apparent certainty of the finished answer. For a question with one dominant answer, repeated runs can look identical. As controlled token-generation benchmarks show, a model returned the same answer to “What is the capital of Australia?” across 200 runs, even at elevated temperature settings. A commercial prompt such as “What are the top three inventory tools for mid-market retail?” has no comparable single answer. Several brands may be plausible, and small changes in generation settings, including temperature or top-p, can change which ones appear and in what order.
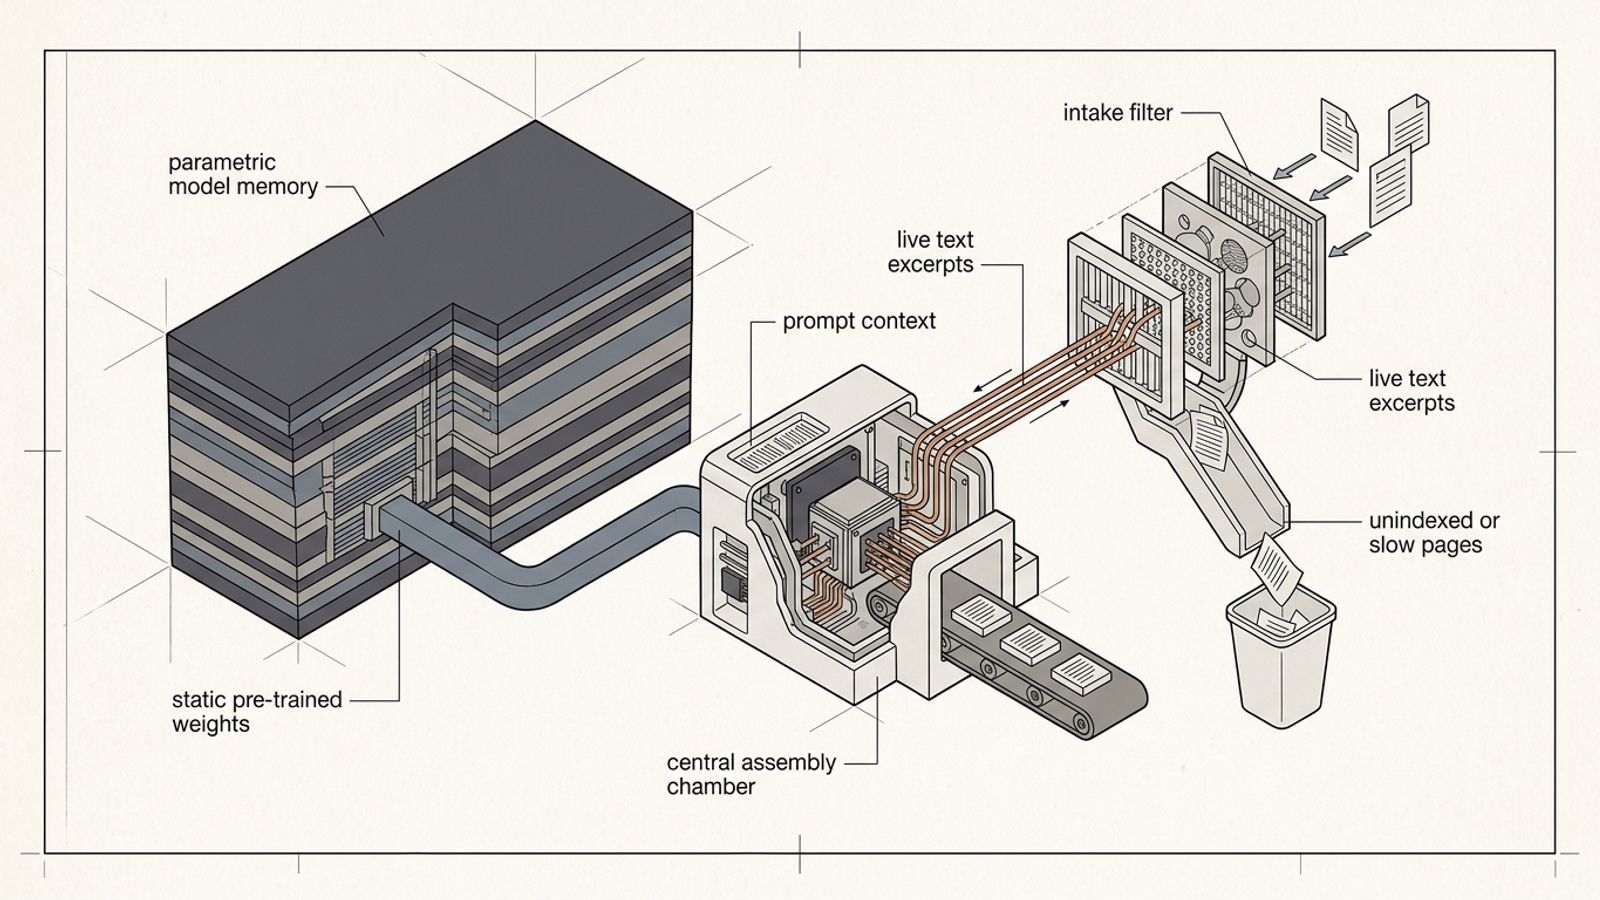
Retrieval adds another source of variation. An engine may answer from what is represented in its model weights, or it may draw on web material fetched or indexed for the task. A slightly different interpretation of “mid-market retail,” a different sub-query, or a different set of available pages can change the context used for the answer. None of those changes requires our warehouse-software company to edit its site.
The resulting order is especially unstable. In a 28-day analysis of more than 70,000 commercial AI answers, Glen Allsopp at Detailed found that ChatGPT returned an identical brand sequence on two random days just 0.3% of the time. For Google AI Overviews, the figure was 1.1%. In the ChatGPT prompts tracked, 41% never returned the same set of brands twice during the four-week run. The study found a more stable core of brands alongside substantial churn among secondary recommendations.
That gives us the first principle for measurement: record whether the brand appears across repeated answers, not whether it owns an imaginary position one.
What a visibility score actually counts
Sample size determines how jumpy the number is
A tool reporting a 60% visibility score may simply mean it found your brand in six of ten answers. Run those ten prompts again and get five mentions, and the score becomes 50%. Your spreadsheet now shows a ten-percentage-point drop. It has not shown why the drop happened, or whether a buyer would encounter your brand less often.
Before reading a trend, ask for the numerator, denominator, prompt set, and repeat count. A score without those four things is hard to interpret. Were there six mentions in ten answers or 600 in 1,000? Did the tool ask the same questions each week? Did it run each question more than once?
In an audit-size test covering 9,327 answers, two readings of an unchanged B2B software brand differed by at least two percentage points in 44% of sample draws using a 15-question audit. With 90 questions, that happened in fewer than 7% of draws. An Otterly.AI study of 252,407 answers across 520 prompts likewise found that increasing tracking volume from 10 to 100 prompts reduced reported brand-coverage variance by 73%.
More samples do not make every prompt useful. They do make it harder for one disappearing mention to masquerade as a strategic reversal. If our warehouse-software company is judged on ten questions, a single answer can move its reported score by ten points. That is arithmetic, not a diagnosis.

Prompt wording decides what gets sampled
Sample size is only half the problem. Ask “What inventory tools do mid-sized retailers use?” and then ask “Which inventory tools suit retail teams with 50 to 200 seats?” You have changed the question. The engine may retrieve different material and recommend different brands. A dashboard can produce a cleaner-looking trend simply by changing the mix of broad and narrow prompts.
Keep the prompt set fixed when you want to measure change over time. Build it around questions a plausible buyer would ask, then document any additions or removals. Otherwise, our warehouse-software company might celebrate a lift that came from swapping general inventory questions for ones tailored to the category where it already appears. I would rather report an awkward, comparable number than a flattering one built from a moving prompt list.
One more distinction belongs in the count: a brand mention is not a citation to the brand’s website. The Otterly.AI dataset found brand coverage more stable than cited URLs; up to 67% of cited source URLs appeared on only one day before disappearing. An answer may still name a product when its citation carousel changes. Blend mentions and links into one percentage, and you cannot tell which signal moved.
For each answer, record the brand mention and the cited URL separately. Our warehouse-software company needs to know whether buyers are hearing its name, whether its own pages are being cited, or whether both are happening. Those are related observations, not interchangeable ones.
Why one number cannot describe three engines
ChatGPT, Gemini, and Google AI Overviews can all recommend inventory software. That does not make their outputs one measurement channel.
In ChatGPT, the first question is whether the test used live web retrieval at all. A run without browsing and a run that can use current web material test different conditions. OpenAI’s crawler documentation also distinguishes GPTBot, used for model-training crawling; OAI-SearchBot, used for search indexing; and ChatGPT-User, which can fetch a page in response to a user request. Those names describe different routes by which our warehouse-software pages might be accessed. They should not be collapsed into “ChatGPT saw us.”
Google AI Overviews draw on Google’s search infrastructure. A query can lead the system to consider related searches and passages before it assembles an overview. The crawl controls are easy to confuse: as Google’s crawler documentation explains, Google-Extended is a robots.txt control token, not a separate crawler user-agent making requests. It should not be mistaken for Googlebot when interpreting server logs or deciding what to block.

Gemini presents another measurement problem: the context available in a user’s session may differ from what a third-party tracker sees in a clean, automated session. A buyer’s location, history, or connected Google services can affect the conditions of a test. Our tracker’s result still tells us something about that tracker’s conditions. It does not reproduce every buyer’s experience.
Report each engine and test setup separately before considering an aggregate. If the warehouse-software brand appears more often in one engine but less often in another, a blended “AI Visibility Index” conceals the very difference the team needs to investigate. An aggregate can summarize; it cannot explain.
The second signal: what AI bots fetched
Answers are outputs. Server requests are inputs. Once we know which pages an engine’s bots fetched, we have another observable signal, though not a substitute for checking the answers themselves.
The first job is verifying who made the request. In 30 days of edge logs on our own site, we counted 13,774 requests claiming to be AI bot hits, but verified only 3,482: a 25.3% verification rate. The rest could not be credited to the bots they claimed to be. As eseospace’s server-log analysis shows, a scraper can put GPTBot or ClaudeBot in its user-agent string while probing endpoints such as /.env.
A claimed user-agent is not proof of an AI visit. Google and Bing bot verification can use forward-confirmed reverse DNS; for OpenAI, Anthropic, and Perplexity, published IP ranges provide a way to check claims against network origin. Count raw user-agent strings as brand momentum and you may be measuring spoofed requests.
Verified requests still need interpretation. A background crawl by GPTBot or OAI-SearchBot tells us a bot requested a page for its broader work. It does not tell us the page appeared in an answer. A verified ChatGPT-User fetch is closer to answer-time activity: it indicates that the page was requested in connection with a user-initiated interaction. It still does not prove that ChatGPT mentioned our brand, cited that URL, or persuaded anyone to buy. For those claims, we need the output and, ultimately, business outcomes.

The useful distinction is simple: a verified fetch shows access; an answer sample shows presentation. Track both. If our warehouse-software page starts receiving verified answer-time fetches while repeated answer tests also show more mentions, the evidence is stronger than either signal alone. If fetches rise but mentions do not, investigate rather than announcing a visibility win.
Test for movement before you claim it
For a practical baseline, I use the logic of The AI Visibility Holdout Test: Measure Mentions, Not Screenshots: hold the testing conditions steady before interpreting a change.
- Choose a fixed set of at least 50 realistic buyer prompts for the product categories you care about. Keep each engine’s results separate.
- Run each prompt five times under the same stated conditions: logged out, a clean browser session, and a fixed geographic IP, within a narrow three-hour window.
- Record mentions and citations separately for every run. Keep the individual results, not just their average.
- Repeat the test over time without quietly replacing prompts. Compare the new results with the spread you observed before making a change.
Suppose our warehouse-software brand appears in three of five runs for one prompt on Monday, two on Wednesday, and four on Friday. Those observations are 60%, 40%, and 80%. Each answer changes that tiny prompt-level sample by 20 percentage points. That is not a defensible claim that the brand’s underlying visibility swung 40 points in a week. Nor does five runs establish a precise statistical band around the true probability. It shows how coarse this particular measurement is.
Now consider a site update followed by an aggregate score moving from 60% to 65%. The difference alone does not show that the update worked. I would look for a movement that persists across repeated runs and days, check that the prompts and engine settings stayed put, and see whether the cited pages and verified fetches support the same story. If the observed spread is 15 points, a ten-prompt victory lap is premature; a sustained 30-point climb across 100 prompts deserves a closer look. The point is not to worship either threshold. It is to measure your own variation before calling a change a result.
A new case: the score rises, but the evidence disagrees
Say our warehouse-software company publishes a new category page. The next weekly dashboard report shows a higher blended visibility score. What do we conclude?
First, check the prompts. If the dashboard added narrower warehouse questions that week, the old and new scores are not comparable. If the prompts stayed fixed, inspect repeated answers by engine. A lift confined to one run is weaker evidence than a lift that persists. Then separate the observations: did the brand appear more often, did its page earn more citations, and did verified bots fetch that page? Finally, ask whether the movement connects to demo requests or pipeline rather than stopping at an attractive percentage.
If mentions rise repeatedly under fixed conditions and the other signals move with them, we have a case worth acting on. If only the blended dashboard number rises, we have a question, not a win. That distinction is where the old agency habit gets expensive: someone can bill for a weekly interpretation of randomness, then bill again when it reverses.
At groas, I would rather put the mechanical work on an always-on growth engine and give a named human strategist responsibility for direction and guardrails. The measurement has to be just as disciplined. Keep the prompt set still, verify the fetches, watch the business outcomes, and make a visibility score earn its decimal point.